Devpost
Participate in our public hackathons
Devpost for Teams
Access your company's private hackathons
Grow your developer ecosystem and promote your platform
Drive innovation, collaboration, and retention within your organization
By use case
Blog
Insights into hackathon planning and participation
Customer stories
Inspiration from peers and other industry leaders
Planning guides
Best practices for planning online and in-person hackathons
Webinars & events
Upcoming events and on-demand recordings
Help desk
Common questions and support documentation
A business focusing on improving public health through community programs and policy changes could use Tableau Next to analyze the adverse health effects of too much screen time for children.
Joseph & Neha's Agentic AI Platform Creates an Insightful Operational Ecosystem in Tableau Next while Simultaneously Establishing Public Trust around Secret Federal Surveillance Flights in the USA.
Unfilled vacancies are costly, impact current staff and product quality negatively. We demonstrate how Tabeau Next Dashboards and Agents accelerate recruiting speed and improve recruiting decisions.
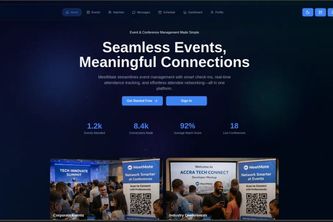
MeetMate – An AI-powered networking platform that helps users connect, schedule meetings, chat, and manage profiles, with insights and support powered by Sensay AI."
A Tableau Next dashboard that detects high-excitement NFL plays, surfaces them to marketing & content teams in Salesforce, and triggers contextual fan outreach to boost engagement in the moment.
From data to foresight: Shaping the future of patient journeys.
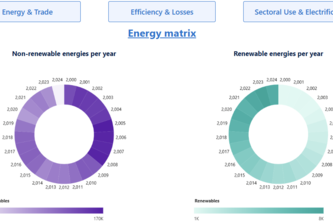
Tableau dashboard on Ireland’s energy system: energy mix, efficiency, consumption, and trade. Insights for innovation, sustainability, and a greener future.
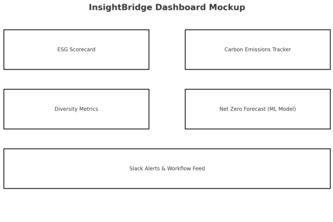
Pulse Telecom ConciergeIQ is an agentic Tableau Next dashboard with Slack integration, built for managers to make confident, data-driven decisions. “Talk to Your Data. Act with Confidence.”
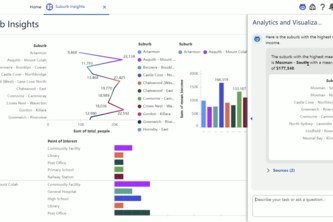
This project aims to provide new immigrants with insights on various suburbs in NSW based on mean income, population count, and number of points of interests e.g. libraries, schools etc.
This idea is designed to invite doctors around the world, allow them to have profiles according to their skillset. People find doctors according to their need of disease and expense.
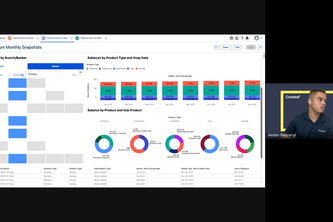
As a Managing Director, interact with a dashboard before conversing with Concierge to identify popular products, untapped revenue potential, and uncover whitespace, within our product offerings.
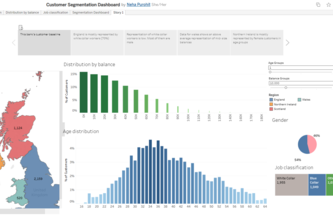
Customer Segmentation Dashboard: Unlocking insights by region, balance, age & job type. Helping banks tailor strategies with data-driven decisions for smarter customer engagement
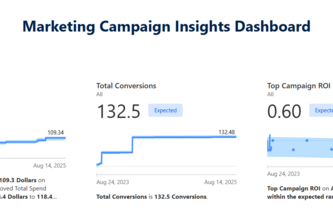
Track marketing campaign performance.
SkyLuxe aggregates empty leg flights across private jet operators, unlocking real-time access to premium aviation at non-premium pricing. The platform addresses a $40B annual opportunity.
With Novalytics, we bridge Salesforce Data Cloud and Tableau Next to deliver insights that don’t just inform — they spark measurable business impact.
EcoChain: Predict sustainability risks before they happen with AI-powered supply chain analytics.
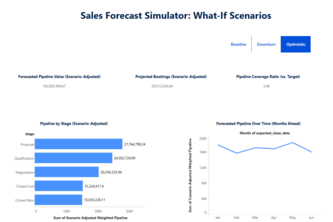
An interactive Weighted Pipeline Simulator that lets sales leaders run what-if analyses on their CRM pipeline, showcasing how agentic analytics can transform forecasting and decision-making.
Transforms warehouse layouts into an interactive dashboard, empowering managers to redesign stock placement, cut picker travel time, and optimize both labor and inventory capacity.
FroNet delivers uncapped, affordable WiFi to underserved African communities, blending Starlink speed with mobile-data pricing through scalable, franchise-led deployments.
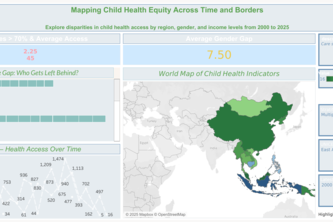
Visualizing child health equity across borders and time.
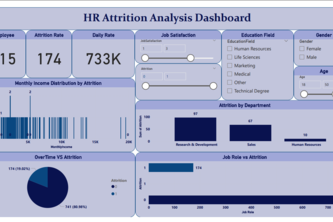
Used machine learning and Tableau to uncover key drivers of employee attrition, enabling data-driven HR strategies to boost retention and employee satisfaction.
InsightBridge empowers enterprises to track, analyze, and act on their ESG (Environmental, Social, and Governance) performance using real-time data visualizations, AI-driven recommendations
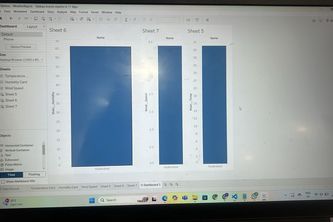
The Personal Weather Station Dashboard is visually engaging, insightful, and gives you room to showcase data storytelling, interactivity, and design.
I made dashboard using different features versus other features. I used box plot, bar plot, pie chart etc.
73 – 96 of 99